
Tokenomics looks simple until an asset page shows circulating supply, total supply, max supply, market cap, FDV, emissions, unlocks and burns at the same time. The mistake is collapsing those numbers into one conclusion such as “small market cap means cheap” or “large burn means price must rise.” Tokenomics does not predict price. It describes the rules by which units are created, distributed, used, unlocked and removed from circulation.
Tokenomics is a system of flows and rights
Supply is only one layer. A complete model asks at least four questions: how many tokens exist now, who controls tokens that are not yet circulating, under which schedule they can become liquid, and why anyone needs the token in the first place.
A token that secures consensus, governs a treasury, pays fees or captures protocol economics has a different model from a token mainly used to bootstrap incentives. Two assets with identical FDV can therefore have radically different economics.
Circulating, total and max supply
**Circulating supply** is the amount a data methodology classifies as available in the market. **Total supply** generally includes issued tokens that still exist, including some locked or treasury balances. **Max supply** is a hard upper bound only when the protocol actually enforces one.
- Circulating supply is used in current market capitalization.
- Total supply helps reveal issued but not necessarily freely tradable tokens.
- Max supply is meaningful only if protocol rules make it credible.
- Emission schedules explain how these quantities can evolve.
Unlocked does not mean immediately sold
An unlock removes a contractual, legal or programmatic restriction. It does **not** prove the holder will instantly sell. The token can now be transferred, delegated, used as collateral, added to liquidity or sold. Unlocks expand possible liquid supply; they do not mechanically equal sell pressure.
Market cap and FDV answer different questions
Market capitalization is simply current token price multiplied by circulating supply. Fully Diluted Valuation applies the same current price to a diluted or maximum supply according to the chosen methodology.
Both metrics are scale indicators, but both depend on a **marginal price**. They do not imply the entire supply could actually be sold at that price.
Why market cap is not money invested
If a small last trade moves price from $9 to $10, the quoted market cap of every circulating token is immediately repriced at $10. Investors did not need to inject an amount equal to the entire change in market capitalization.
Market cap is the marginal price of a token extrapolated across circulating supply. It is not the project's bank balance and not cumulative historical capital invested.
FDV is useful as a dilution scenario
FDV asks what valuation would be implied if the selected diluted supply existed at today's price. It is not a forecast of future market capitalization. Price will almost certainly change before future unlocks arrive.
| Metric | Formula | What it shows | What it does not show |
|---|---|---|---|
| Market cap | Price × circulating supply | Scale of currently circulating supply | Money actually invested |
| FDV | Price × diluted/max supply | Scale under full selected supply | Future price after unlocks |
| Float ratio | Circulating / diluted supply | How much supply is already circulating | Who controls locked supply |
| Annual dilution | New net supply / starting supply | Rate of supply expansion | Demand for newly issued tokens |
Emissions and unlocks create a supply waterfall
Supply rarely arrives all at once. Team, investors, ecosystem treasury, airdrops, staking rewards and grant programs can each follow independent schedules. Think of them as a waterfall: each flow can add potentially circulating supply under different rules.
Linear vesting and cliffs
Linear vesting unlocks tokens gradually. A cliff creates a period with no access, followed by a large first unlock or the beginning of a linear schedule. Two allocations with the same total size can therefore create very different short-term market structure.
Imagine one billion team tokens. Plan A unlocks evenly over 48 months. Plan B has a 12-month cliff followed by a large first unlock and then linear vesting. The final amount is identical; the liquidity shock is not.
The unlock calendar matters more than one FDV number
High FDV with slow multi-year issuance is a different risk profile from the same FDV with a huge unlock two weeks away. Valuation should therefore be read together with the supply calendar.
Allocation reveals future holders and potential liquidity
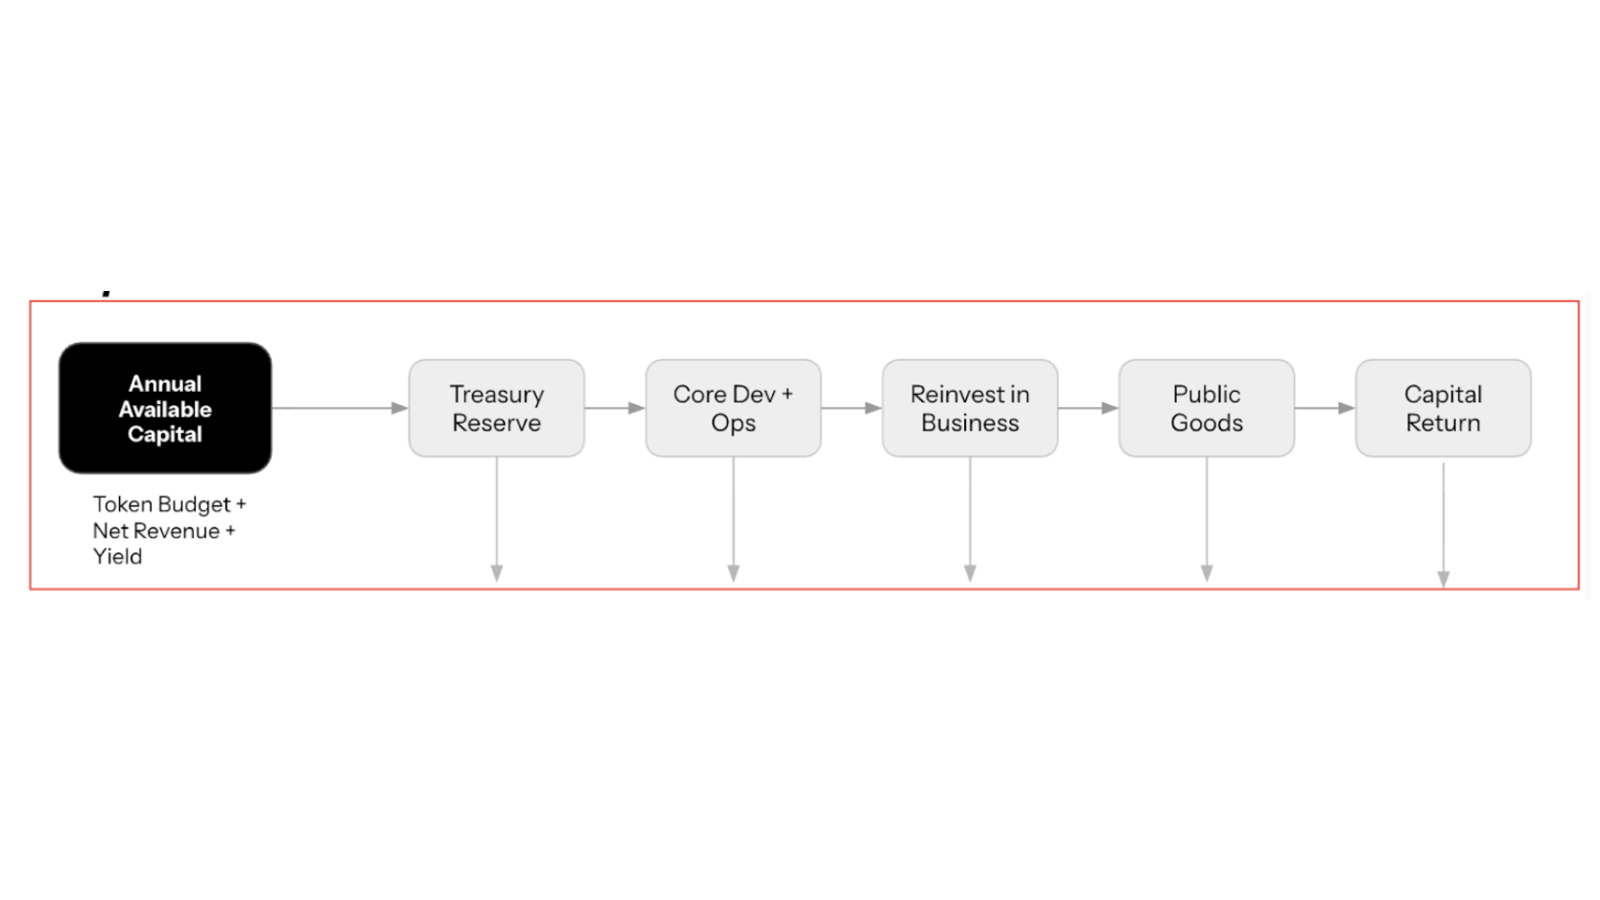
A pie chart of team, investors and community is useful but incomplete. What matters is the rights attached to each bucket. Investor tokens may vest. Treasury balances may require governance approval. Airdrop allocations can distribute across hundreds of thousands of addresses. Ecosystem incentives only enter circulation when programs actually deploy them.
Optimism is a useful example. Its initial OP supply was allocated across ecosystem funding, public-goods funding, airdrops, core contributors and investors. Actual circulating supply depends on unlocks, grants and governance decisions rather than the original allocation chart alone.
Treasury balance is not automatically market float
A treasury wallet can technically hold transferable tokens while governance policy limits how they can be spent. Data providers may classify those tokens differently from exchange balances or freely held tokens.
Concentration matters more than a “community” label
Even a large community allocation can temporarily be controlled by a foundation multisig, distributor contract or governance treasury. Analysts should inspect real addresses and authority rather than relying on category names.
Burns reduce supply but do not create demand
A burn destroys or permanently removes tokens from usable supply according to protocol rules. In the supply equation it is a negative flow. Its economic effect still depends on where the burned tokens come from and what happens to demand.
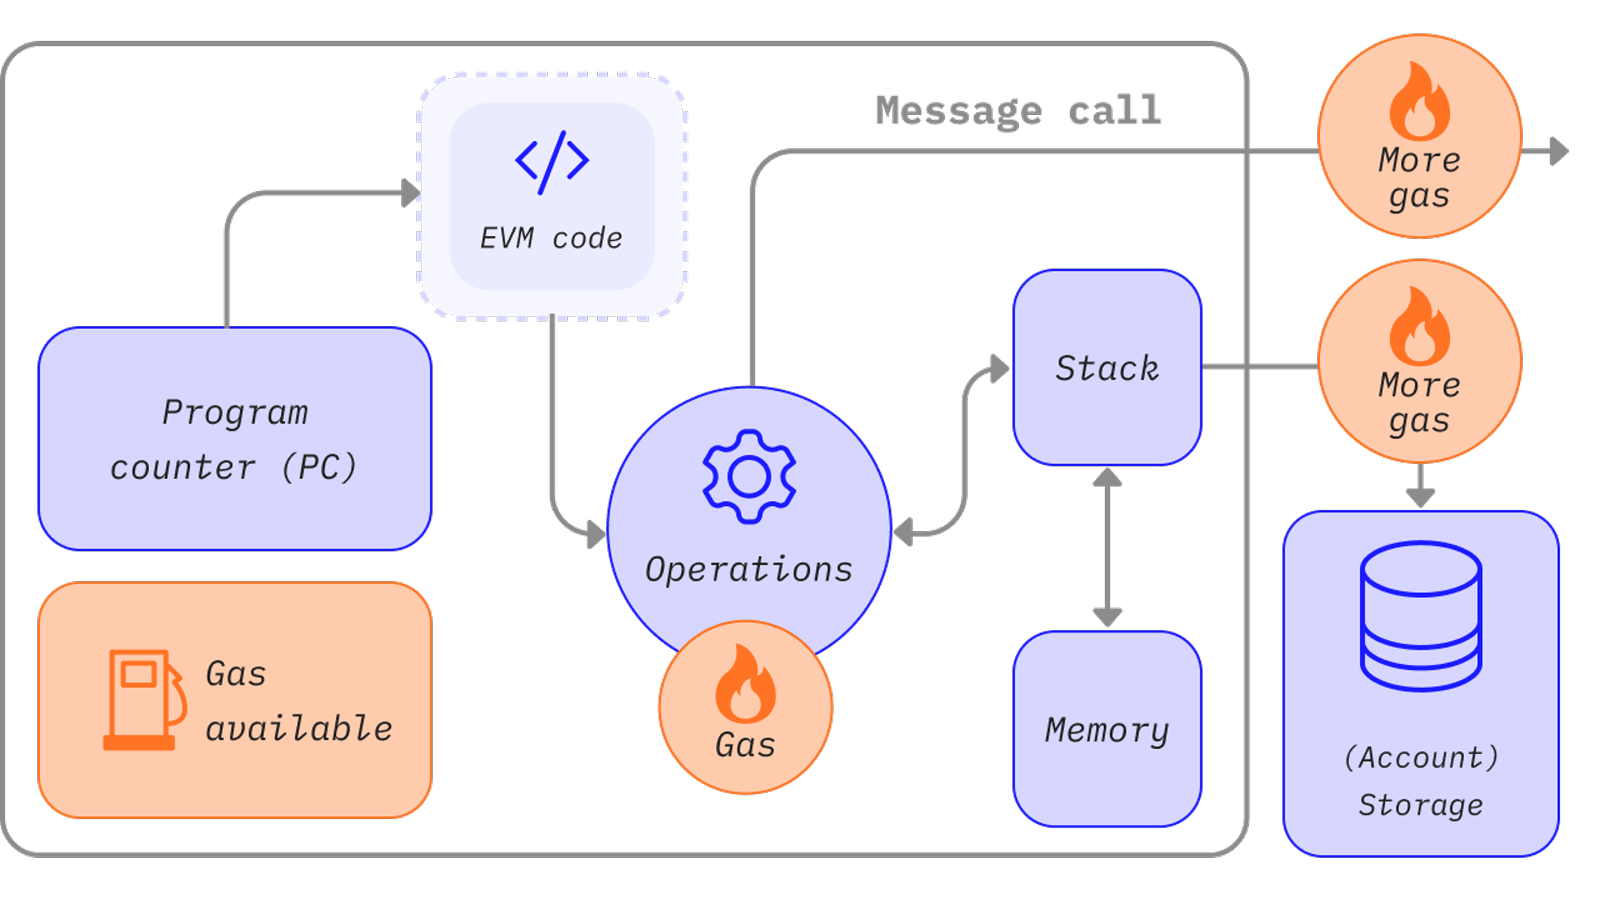
Ethereum's EIP-1559 provides a clean technical example: the protocol base fee for gas is burned rather than paid to the block producer. Network activity therefore creates a burn flow that offsets issuance.
Net issuance matters more than gross burn
If a system creates one million new tokens and burns two hundred thousand, supply still increases by eight hundred thousand. A headline about the burn alone is incomplete.
A simplified supply equation is:
- **Net supply change = gross issuance − burn ± other mint/burn flows.**
- When issuance exceeds burn, supply grows.
- When burn exceeds issuance, supply contracts over that interval.
A burn does not guarantee price appreciation
Price reflects both demand and available supply. A burn can shrink supply while demand declines even faster. The economic path also differs between burning protocol fees and a buyback, where a protocol first earns revenue and then purchases tokens in the market.
Issuance can fund security rather than arbitrary dilution
New issuance often pays validators, miners, liquidity providers or ecosystem contributors. The right question is what service the network receives in exchange. Staking rewards can finance consensus security. Liquidity incentives can bootstrap depth. Grants can fund infrastructure.
The problem is not issuance by itself. The problem is supply creation that persistently outruns useful demand or fails to purchase durable network services.

Token inflation and ownership dilution
If a holder owns 100 tokens while total supply grows from 1,000 to 1,100, their share of the system falls from 10% to about 9.09% unless they receive part of the new issuance. This is why staking can serve not only as yield but as a way to preserve relative ownership in an inflationary PoS system.
Utility and value capture are not the same thing
A project can list many token uses: governance, staking, fee payment, collateral and discounts. Utility does not automatically mean growth in protocol activity creates durable demand for the token.
If users can pay fees with other assets, governance rarely matters and staking rewards are funded almost entirely by new issuance, value capture may be weaker than the feature list suggests.
Fee token
When a token pays for a scarce network resource, activity creates transactional demand. But users may buy it immediately before a transaction and spend it immediately, so velocity matters.
Staking or security token
If validators must lock the token to obtain consensus power, part of supply becomes less liquid. In return the system creates rewards and slashing exposure. Utility is directly connected to network security.
Governance token
Governance rights are valuable to the extent governance controls important parameters and treasury assets. Distribution of voting power therefore becomes part of tokenomics.
How to audit tokenomics before buying or integrating a token
Start with contracts and official accounting rather than the allocation graphic. Identify the token contract, mint authority, burn logic, treasury addresses and vesting contracts. Then reconcile them with a data provider's methodology.
- Record circulating, total and max/diluted supply with a timestamp.
- Identify every mint permission and whether max supply can change.
- Build an unlock schedule for at least the next 12–24 months.
- Separate team, investor, treasury, grant, reward and airdrop flows.
- Calculate net issuance, not just gross emissions or burns.
- Measure concentration of controlled buckets.
- Read market cap and FDV together with float ratio.
- Identify the real demand mechanism created by token utility.
- Check whether governance can change emission rules.
- Re-run the model after upgrades and large treasury decisions.
Red flags without making a price prediction
No single low-float ratio or large unlock is automatically fatal. More informative combinations are low float + nearby cliff + concentrated ownership; high staking APY + aggressive issuance; claimed fixed cap + live admin mint authority; or a large burn headline accompanied by even larger reward emissions.
Good tokenomics does not mean “price must rise.” It means supply and value-transfer rules are transparent, measurable and aligned with the network's function.
The main conclusion
Market cap, FDV, unlocks and burns are not independent marketing numbers. They describe one dynamic system. Market cap uses circulating supply and marginal price. FDV applies that price to a diluted scenario. Unlocks change the usability of previously restricted supply. Emissions create new units, burns remove some units, and utility determines why anyone needs the asset.
The most useful approach is to treat token supply like a flow ledger: what entered circulation, what left, who controls the next flow, and which network service that flow is paying for. Once those questions are answered, tokenomics stops being a pie chart and becomes an engineering-economic model.
FAQ
Is market cap the amount of money invested in a token?
No. It is current marginal price multiplied by circulating supply. Market cap can change without an equal dollar amount entering or leaving the market.
Does FDV predict future market capitalization?
No. FDV applies today's price to a diluted supply assumption. Price and demand can be completely different when future unlocks occur.
Does every unlock cause the price to fall?
No. Unlocks expand possible supply, but holders can keep, stake, delegate or use tokens instead of selling them. Market impact depends on demand, expectations and actual holder behavior.
Does a burn make a token deflationary?
Only if burn exceeds new issuance and other positive supply flows over the chosen interval. Net supply change is what matters.
Why can circulating supply differ across data services?
Because treasury, locked, foundation and contract balances are classified according to each provider's methodology. Complex tokens should be checked against onchain addresses.
Is high staking yield always good for holders?
No. If rewards are funded by rapid issuance, the holder's token balance grows at the same time as total supply. Dilution-adjusted return and staking risks matter.
This material is educational and informational. It is not financial advice or a trading signal.