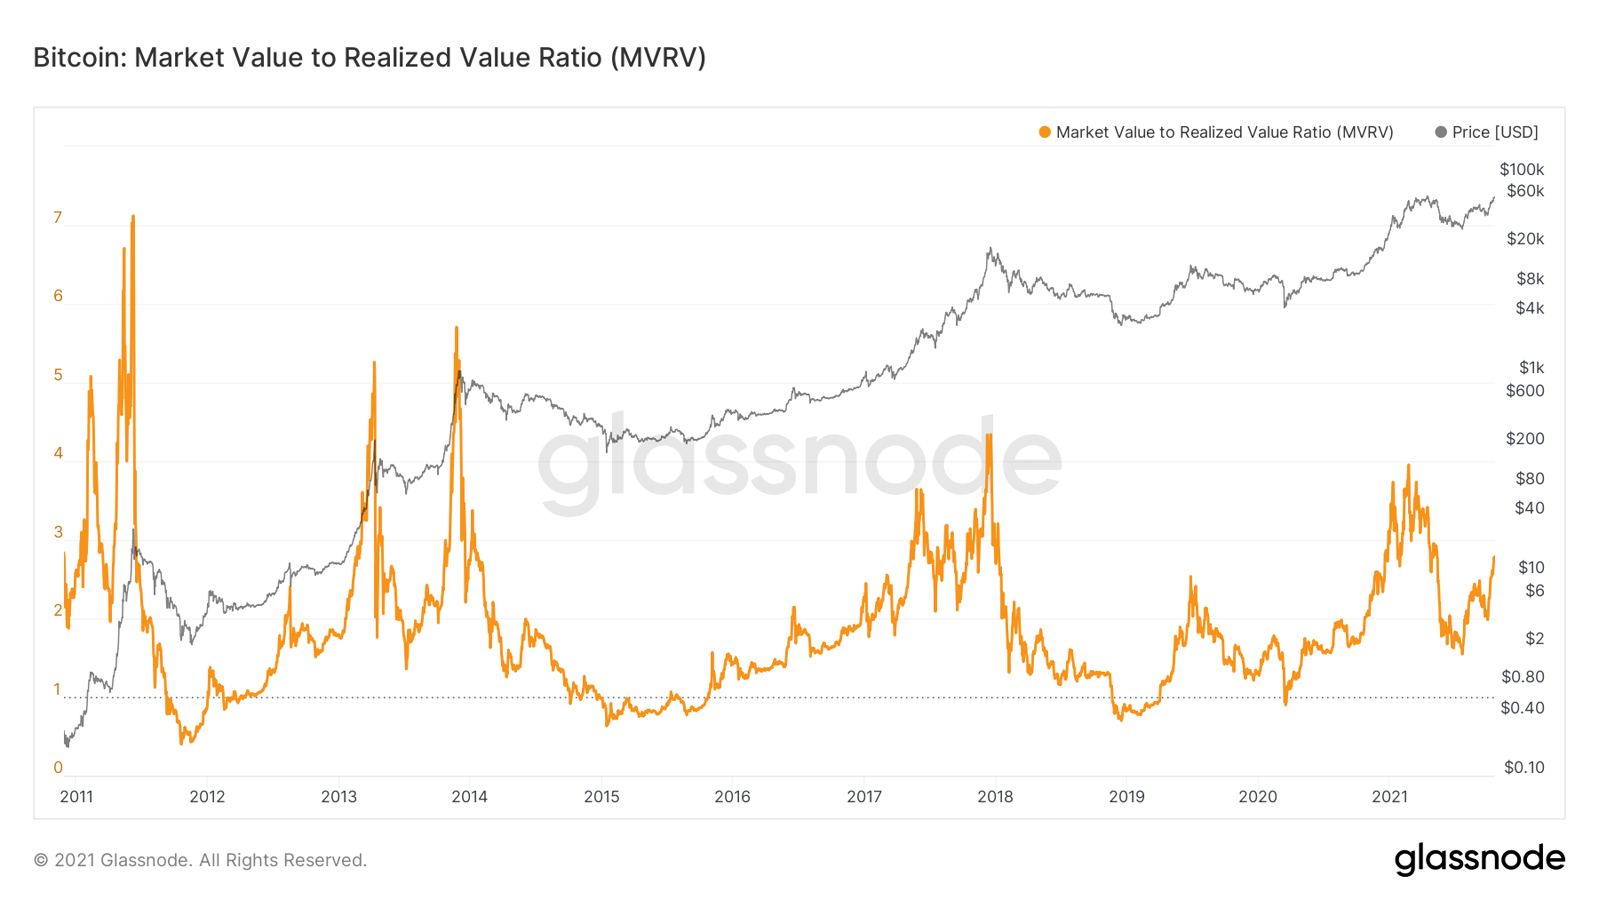
On-chain analytics is powerful not because “the blockchain knows everything,” but because a public ledger lets us reproducibly measure what is actually recorded on-chain. An address is not a person, a UTXO movement is not necessarily a purchase, and a lack of movement does not prove ownership has not changed. MVRV, NUPL and realized cap are therefore useful models of ledger state—and dangerous when treated as direct sensors of investor intent.
An on-chain metric is a transformation of data, not mind-reading
A blockchain is excellent at answering questions such as which output was spent, when an address received an asset, or how many coins fall into a particular age cohort. It is much worse at answering why any of those events occurred.
One transfer can be a sale, an exchange's internal wallet reshuffle, a cold-storage migration, a collateral deposit or a bridge operation. One address can represent millions of custodial users, while one user can control thousands of addresses. Every analytical metric therefore sits on top of assumptions.
Three layers that should not be mixed
- **Raw ledger fact:** transaction, output, address balance, block timestamp.
- **Derived metric:** realized cap, MVRV, NUPL, HODL Waves.
- **Interpretation:** capitulation, accumulation, distribution, euphoria.
The first two can be reproduced under the same methodology. The third is already a hypothesis. The further analysis moves from ledger fact toward market psychology, the more explicitly assumptions should be stated.
Historical correlation is not causation
If high MVRV coincided with late bull-market phases several times, that does not mean MVRV itself caused the market to fall. Both can be consequences of the same underlying event: a large price increase and accumulated unrealized profit. A metric describes state; it is not necessarily a causal trigger.
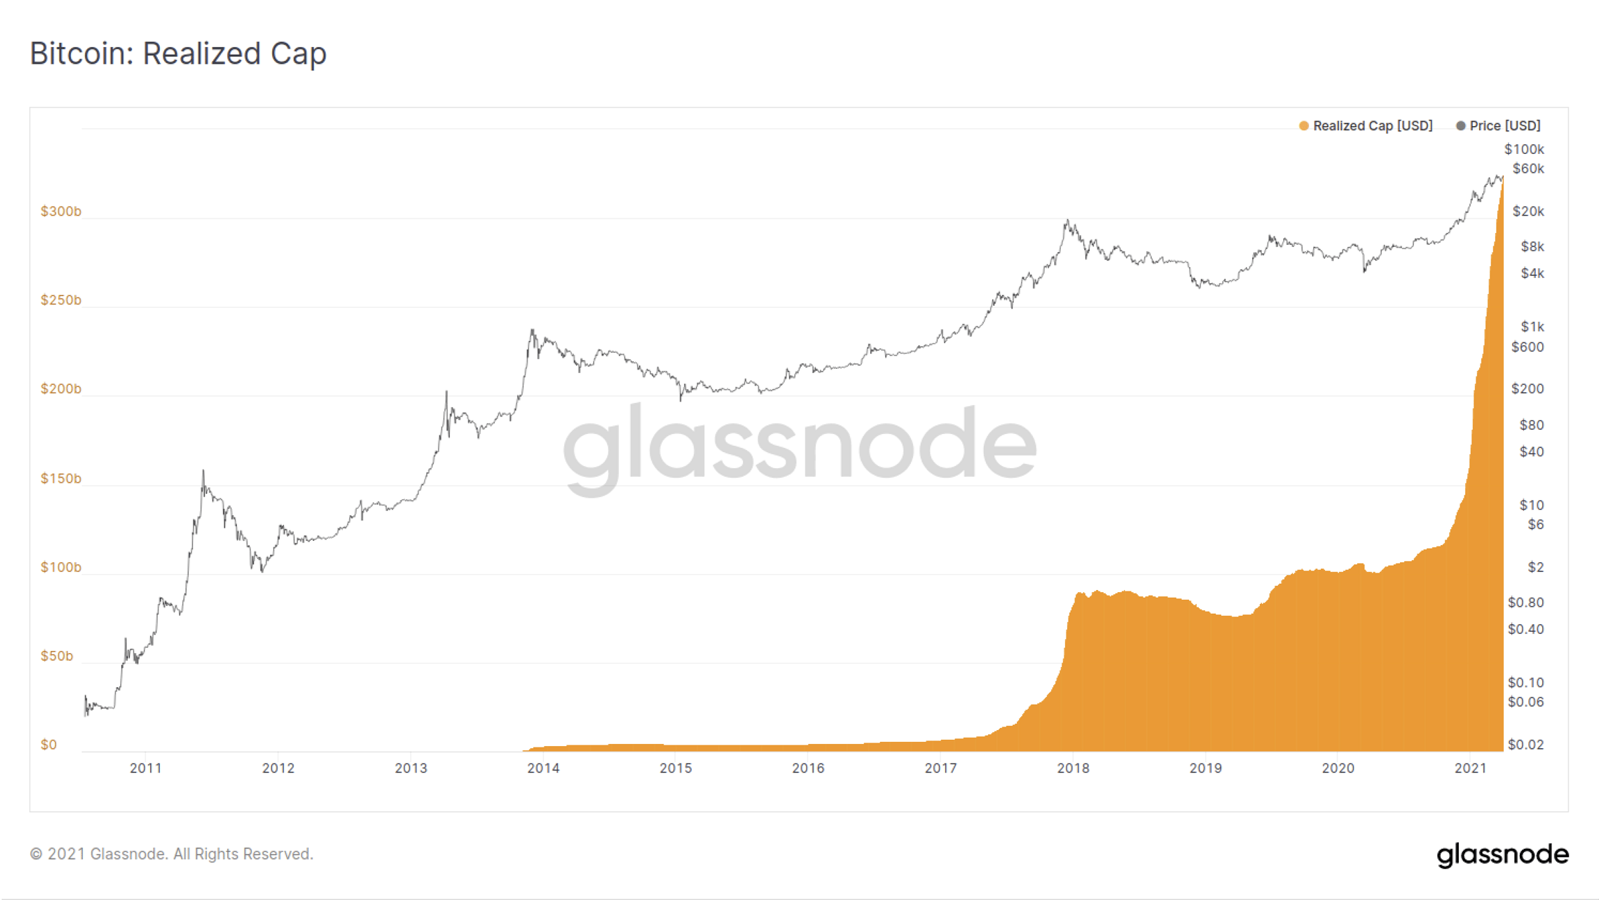
Realized cap reprices coins at their last on-chain movement
Traditional market capitalization values circulating supply at today's marginal price. Realized capitalization takes a different approach: each UTXO is valued at the market price when that output was created by its most recent on-chain movement.
For a UTXO network, the simplified model is:
**Realized Cap = Σ(valueᵢ × price_at_last_moveᵢ)**
If 1 BTC last moved when the market price was $8,000, it contributes roughly $8,000 to realized cap regardless of today's price. If that BTC moves again around $100,000, its contribution is repriced toward the new level.
Why realized cap is described as a proxy for aggregate cost basis
If every on-chain movement represented a true transfer of economic ownership, the last-movement price would be a reasonable acquisition-price proxy. Summing those modeled cost bases produces an estimate of capital stored in the network.
The word **proxy** is critical. The blockchain does not know whether Alice sold a coin to Bob or simply moved it from one hardware wallet to another.
Realized price is the same model expressed per coin
Realized Price is generally Realized Cap divided by current supply. It is a useful aggregate cost-basis line, but it should not be interpreted as the literal average purchase price of every present beneficial owner.
Realized price is an average produced by a ledger model, not a broker statement showing every investor's true cost basis.
MVRV measures market valuation relative to realized basis
MVRV stands for Market Value to Realized Value. Its formula is straightforward:
**MVRV = Market Cap / Realized Cap**
At MVRV = 1, current market capitalization equals realized capitalization. Values above one mean market value exceeds the modeled aggregate cost basis; values below one mean market value is below it.
What MVRV actually tells you
High MVRV means a large gap between current supply valuation and the prices at which coins last moved. In a UTXO interpretation, that corresponds to significant aggregate unrealized profit.
Low MVRV means less unrealized profit or aggregate unrealized loss. Historical MVRV extremes have been studied across Bitcoin cycles, but historical thresholds should not become permanent buy/sell levels.
Why fixed thresholds age
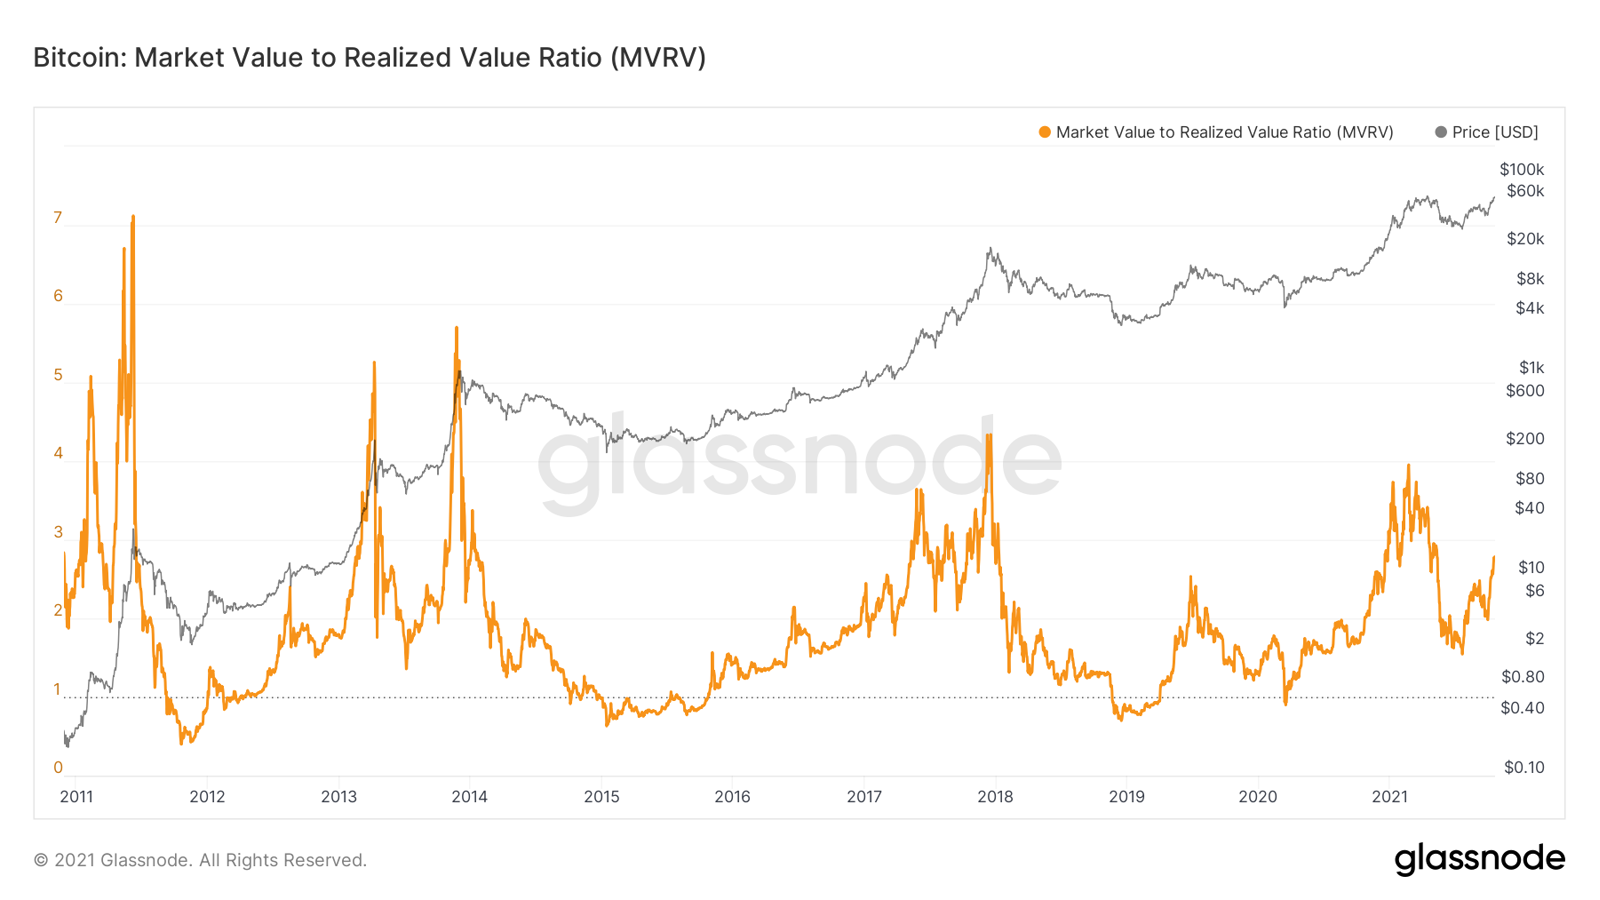
Glassnode documents historical zones such as MVRV above 3.5 or below 1 as notable in past Bitcoin cycles. Holder distribution, institutional custody, ETF structure, derivatives, exchange behavior and market depth all evolve over time.
It is usually more defensible to study percentiles, regimes, trends and context rather than treating a number found on an old chart as a physical constant.
NUPL is a normalized view of the same PnL geometry
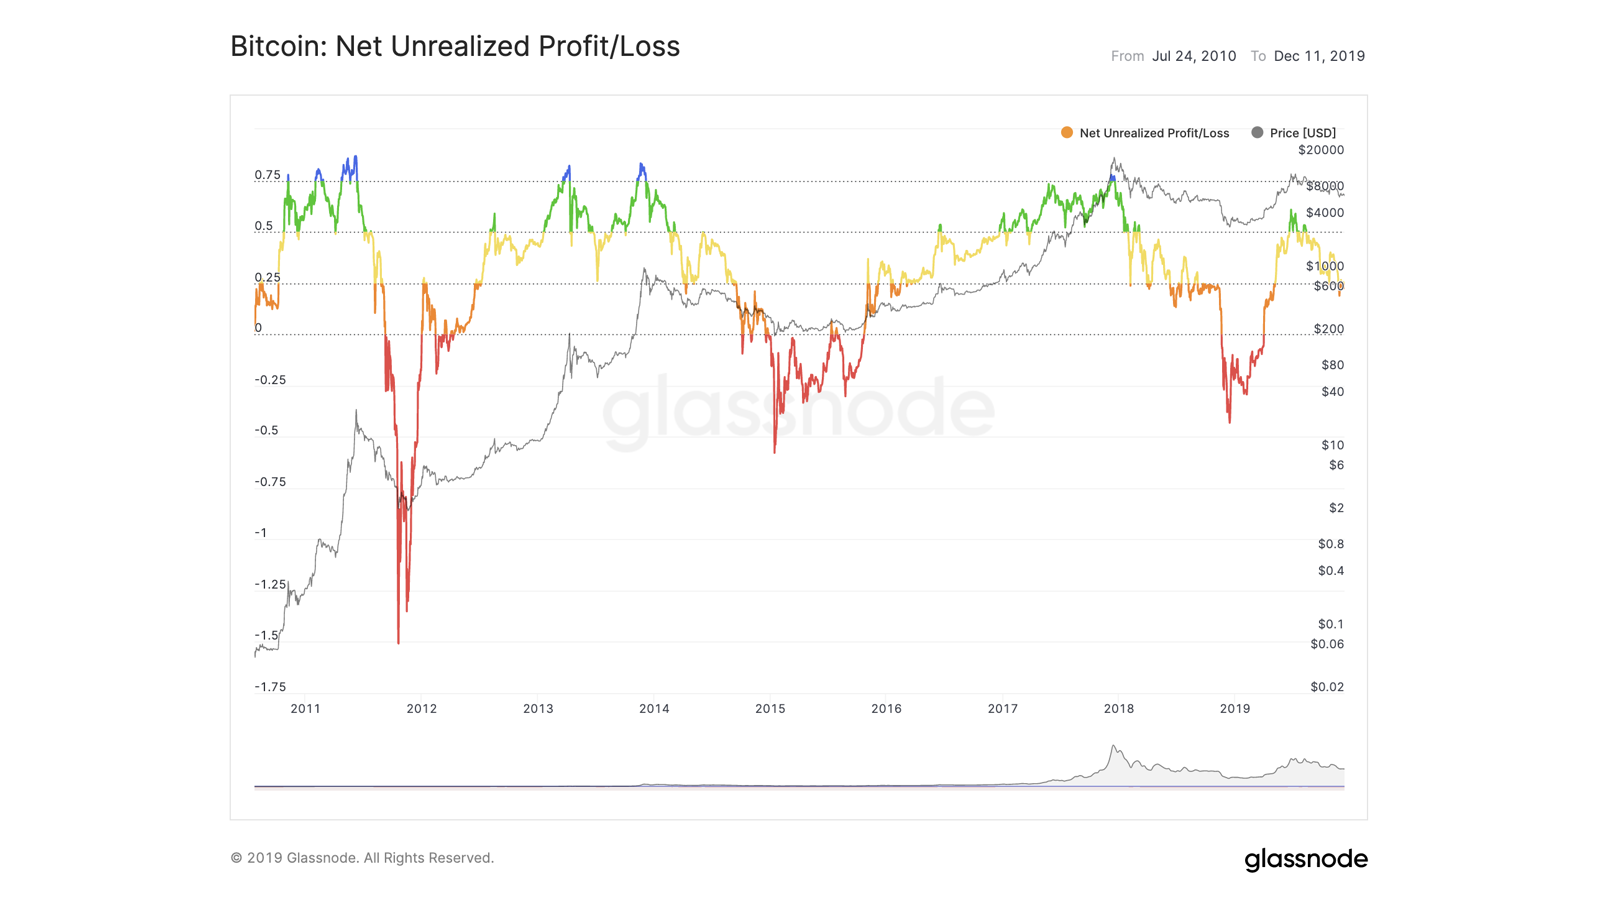
NUPL means Net Unrealized Profit/Loss. Glassnode defines it as Relative Unrealized Profit minus Relative Unrealized Loss. The equivalent formula is:
**NUPL = (Market Cap − Realized Cap) / Market Cap**
Positive values indicate net unrealized profit under the model, while negative values indicate net unrealized loss.
MVRV and NUPL are not independent
If both metrics use the **same** Market Cap and Realized Cap definitions, then:
**NUPL = 1 − 1 / MVRV**
This matters in quantitative analysis. Treating MVRV and NUPL as two independent confirming signals effectively double-weights the same underlying information.
| MVRV | NUPL by formula | Intuitive model |
|---|---|---|
| 0.8 | −0.25 | Market cap below realized cap |
| 1.0 | 0.00 | Aggregate modeled break-even |
| 1.5 | 0.33 | Material unrealized profit |
| 2.0 | 0.50 | Market cap twice realized cap |
| 4.0 | 0.75 | Very large market-vs-basis gap |
This is a form of feature leakage in analytics
A model containing dozens of on-chain indicators should be checked for algebraic dependence. NUPL, MVRV, realized price and realized-cap derivatives often carry overlapping information. More columns do not automatically mean more independent factors.
UTXO age bands describe ledger time, not holder conviction
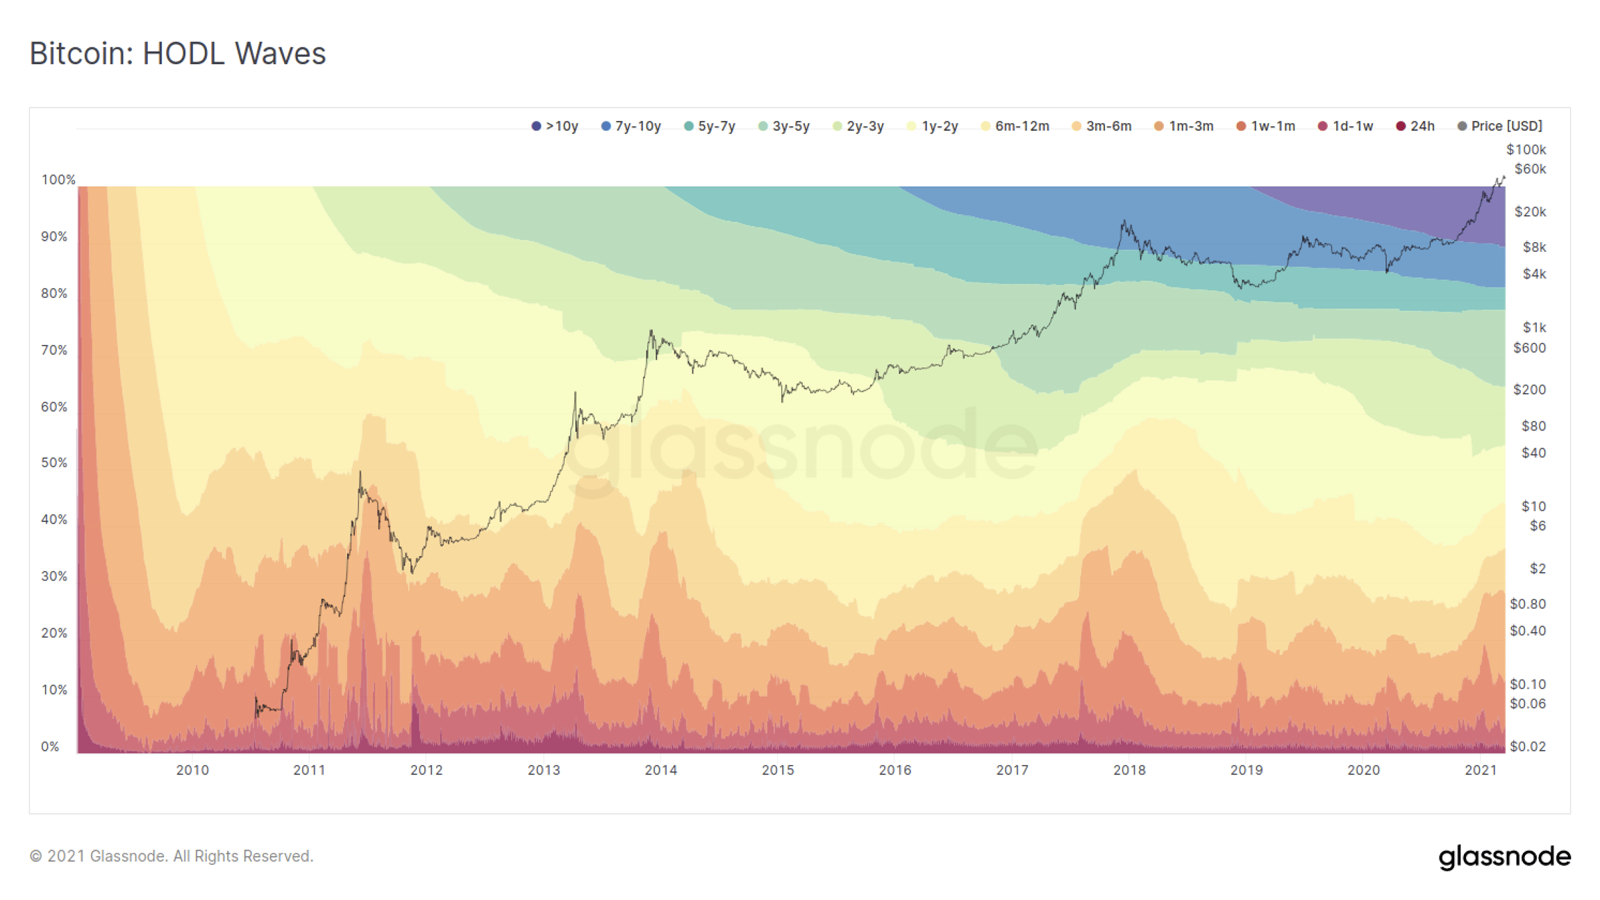
A Bitcoin UTXO has an age: time elapsed since the output was created. HODL Waves group supply into age bands such as under one day, one day to one week, one to three months, one to two years and so on.
This is useful for observing how much supply moved recently versus how much remains dormant. But “HODL” is already an interpretation. An old UTXO can be a lost coin, an exchange reserve or an asset belonging to someone who simply never moved it.
Young coins do not necessarily belong to speculators
Exchange wallet reshuffling can create many young outputs without changing beneficial ownership. UTXO consolidation resets age too. Conversely, trading inside a custodial exchange can change economic ownership completely while leaving the base-layer UTXO untouched.
The LTH/STH boundary is a useful heuristic, not a law of nature
Glassnode uses 155 days to separate Long-Term and Short-Term Holder cohorts in several Bitcoin metrics. The boundary comes from an empirical model of spending probability. It is useful for consistent time-series analysis, but a 154-day-old coin does not become psychologically different one day later.
Where realized metrics fail systematically
The most dangerous on-chain error is not random noise but a systematic mismatch between the metric's assumption and real economic ownership.
Self-transfers reprice modeled cost basis without a trade
If an owner moves BTC from one wallet they control to another, a new UTXO is created at the current timestamp and price basis in the realized-cap framework. No economic acquisition occurred, but the metric observes movement.
Entity-adjusted analytics attempts to identify internal transfers through clustering heuristics. Those heuristics are useful but imperfect; they cannot cryptographically prove that two addresses belong to the same beneficial owner.
Custodial exchanges change owners off-chain
An exchange can hold 10,000 BTC in cold wallets while thousands of users buy and sell claims on those BTC in an internal ledger. Beneficial ownership changes continuously while the blockchain may show no movement for months.
For realized cap, that leaves stale on-chain cost basis where users' true economic cost basis may have changed many times.
Lost coins are both a feature and a limitation
Realized cap reduces the contribution of very old coins that have not moved, which is often considered an advantage over market cap. Lost early BTC are not repriced to today's market price.
But the algorithm cannot know whether a coin is lost or merely held for fifteen years. If an ancient UTXO suddenly moves, realized cap receives a large repricing event.
Bridges, staking and smart-contract custody complicate account-based chains
UTXO logic is natural for Bitcoin. Ethereum and token ecosystems use accounts and contracts. A staking deposit, bridge lock, L2 bridge, DEX pool or vault can alter economic state without mapping cleanly to “the last purchase price of this address.”
Modern providers build address-based and entity-based breakdowns across different chains, but cross-chain comparability comes from additional methodology, not because all blockchains share identical accounting models.
Price source and methodology are part of the metric itself
To reprice an output in dollars, an analyst needs the historical market price at the moment it moved. Realized cap therefore depends not only on the chain but also on price datasets, timestamp conventions, venue aggregation and fork treatment.
Two providers can honestly produce slightly different time series from the same blockchain if they use different price sources, entity adjustment or supply definitions.
Point-in-time data can be revised
Entity clustering can improve retrospectively. A wallet unknown yesterday may be classified tomorrow as an exchange address. Historical entity-adjusted metrics can then be recomputed.
For research, dataset version and extraction date should be preserved. An immutable blockchain does not imply every derived analytics series is immutable.
Data frequency can create false precision
A daily metric is not automatically useful for a minute-level strategy. Price can change market cap and NUPL instantly while the UTXO set evolves on block cadence. Mixing incompatible frequencies can create artifacts.
How to use on-chain metrics as data science rather than astrology
A strong workflow starts with a hypothesis instead of a colorful chart. For example: “growth in young supply after a long dormancy period is associated with higher realized selling activity.” The metric, horizon and out-of-sample test are then selected to evaluate that hypothesis.
- Write down the formula and source fields.
- Identify algebraically dependent indicators.
- Record provider methodology and entity adjustment.
- Separate UTXO movement from beneficial ownership.
- Prefer historical percentiles over permanent magic thresholds.
- Test multiple market regimes.
- Use walk-forward and out-of-sample validation.
- Include latency, revisions and costs when metrics feed a strategy.
- Check robustness against another provider when feasible.
- Describe interpretation uncertainty explicitly.
The more convincing a historical chart looks with colored labels such as fear, hope and greed, the stricter the out-of-sample test should be. A beautiful match to past cycles is the beginning of research, not the end.
Do not turn cycle labels into causal states
NUPL charts are often colored with sentiment zones. They are useful visual shorthand, but the colors do not exist in the blockchain. They are thresholds applied during post-processing to a continuous metric.
Test incremental information
If a model already uses MVRV, adding NUPL contributes almost no independent information under identical methodology. It is often more valuable to search for orthogonal features such as liquidity, derivatives positioning, network activity or macro variables and test whether they improve out-of-sample performance.
The main conclusion
Realized cap, MVRV and NUPL provide a powerful language for describing aggregate cost-basis state in a public ledger. Realized cap reprices coins at their last on-chain movement. MVRV compares market value with that basis. NUPL normalizes the same gap by market cap. HODL Waves add a time structure to supply.
None of these metrics knows the true beneficial owner, transaction motive or future demand. A self-transfer can look like a new cost basis, custodial trading can leave no on-chain trace, lost coins are mixed with conviction holders, and entity clustering remains a heuristic layer.
Mature on-chain analysis therefore does not ask “does MVRV say buy or sell?” It asks: what quantity did we measure, which assumptions are embedded in the formula, how much independent information does it add, and does the interpretation survive outside the historical period where it was invented?
FAQ
What is realized cap in plain English?
It is a capitalization model where each coin is valued at the market price of its last on-chain movement rather than valuing all supply at today's price.
What does MVRV = 1 mean?
Market cap equals realized cap under the selected methodology. It is an aggregate modeled break-even point, not proof that every investor is exactly at break-even.
Are NUPL and MVRV independent signals?
No, not when both use the same Market Cap and Realized Cap. Then NUPL = 1 − 1/MVRV, meaning they are different representations of the same underlying relationship.
Why can a self-transfer distort realized cap?
Because the new output is created at the current price even if beneficial ownership did not change. Entity-adjusted heuristics try to filter internal movements but cannot do so perfectly.
Can on-chain analytics see trades inside Binance or Coinbase?
Not necessarily. Custodial trading changes ownership in the exchange's internal ledger while base-chain coins can remain in the same cold wallet.
Can historical MVRV thresholds be used for automated trading?
Only after separate out-of-sample testing. Historical levels describe past regimes and can fail when custody, liquidity and market structure change.
This material is educational and informational. It is not financial advice or a trading signal.