
The question
In this ETH/USDT review, the target is about half the stop distance from entry. Orenix highlighted weak potential reward relative to risk and suggested waiting for directional confirmation.
The editorial team prepared demonstration parameters around a public Binance USD-M quote. The assessment ran on 12 November 2026 at 06:42:34 UTC; its inputs and response were retained.
The submitted idea
| Parameter | Value |
|---|---|
| Pair | ETHUSDT |
| Direction | LONG |
| Entry | 2,045.52 USDT |
| Stop Loss | 2,004.61 USDT |
| Take Profit | 2,065.98 USDT |
| Leverage | 1× |
| Timeframe | 1h |
| Style | intraday |
The reference quote came from public Binance USD-M data. For this demonstration, the stop distance was set near 2% of entry and the target near 1%.
The captured Orenix response
| Response field | Value |
|---|---|
| Score | 62 |
| Verdict | WAIT |
| Risk level | Medium |
| Risk/Reward | approximately 0.50 |
| Price in Orenix context | 2,045.63 USDT |
| Direction aligned | no |
| Primary observation | Target too close relative to the stop |
| Additional observation | Direction not confirmed |
| Next step | Wait for confirmation |
Market context was available at the time of the request. The result belongs to that snapshot and does not describe market conditions when this article is read.
Checking the arithmetic
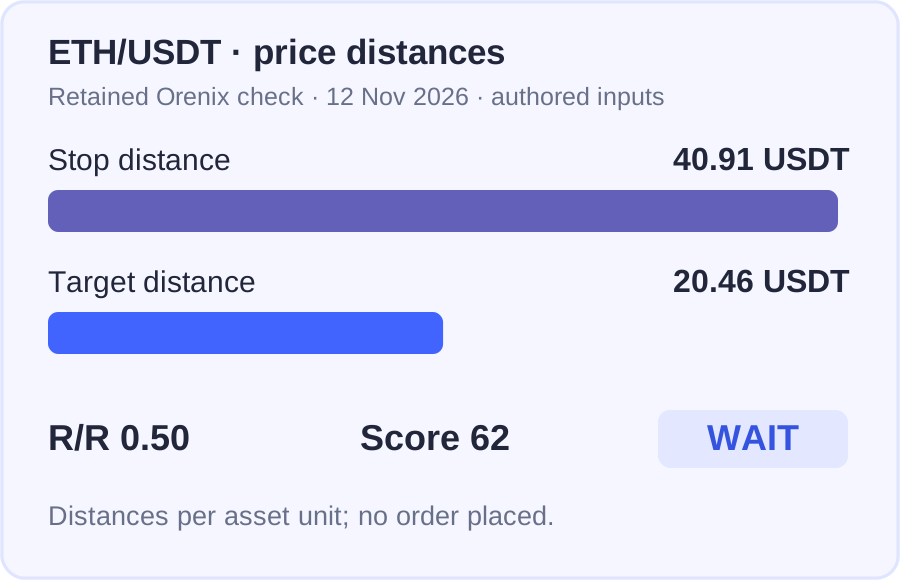
Stop distance was 2,045.52 − 2,004.61 = 40.91 USDT per ETH. Target distance was 2,065.98 − 2,045.52 = 20.46 USDT per ETH. Dividing 20.46 by 40.91 gives approximately 0.5001, rounded here to 0.50.
These are price distances. Cash risk also depends on position size, which was not supplied in this request. Potential gain and loss distances are not promises about execution prices.
Understanding weak risk/reward
If the full stop distance is denoted by 1R, the target here is approximately 0.5R. In a simplified model, one full target outcome and one full stop outcome would total approximately −0.5R before costs. That is arithmetic using two hypothetical outcomes, not a history of two executed trades.
For a model containing only +0.5R and −1R outcomes with no fees, the break-even win fraction is approximately 66.7%. This is neither a probability estimate for this idea nor Orenix performance statistics. Real execution, partial exits and expenses can change the calculation.
A useful question is therefore what justifies the relationship between target and protective exit. Low risk/reward alone does not establish that a trade will lose, but it is relevant to reviewing the idea.

Reading the Orenix assessment alongside R/R
Orenix identified two conditions: the target was too close relative to the stop, and market direction did not support the idea. Read Score 62 alongside those observations; it is not a measured probability of profit.
A cash calculation also needs quantity and costs. Apply fees, funding and slippage assumptions appropriate to the instrument and execution conditions.
What to retain when reviewing an idea
- Original levels and direction without changing them to fit an outcome.
- Assessment time and the reference price source.
- Risk/reward together with the exact warnings.
- Unknown assumptions: position size, costs, execution and scenario expiry.
- Changes to the original plan if you subsequently observe it in demo/paper.
Use current parameters for your own idea and retain the assessment explanation. Record further demo observation separately with rules chosen in advance.
Using the review result
The review helps identify weaknesses before an execution decision: here, a small target relative to risk and missing directional confirmation. Compare the explanation with the original entry rationale, then retain the decision or a revised idea.
Review data
Prepared by the Orenix.net editorial team using the retained assessment request and response from 12 November 2026. Binance USD-M supplied the reference quote; levels were defined for demonstration. The assessment concerns that data snapshot rather than current conditions or an executed-trade outcome.